We have seen many global analyses of plant traits. Admittedly, many of them are intriguing and insightful. However, there is a reoccurring issue evident in most global analysis, is that some of the results are merely showing a difference between tundra and tropical forest, or a difference between desert bushes and evergreen forests. These environments are so ecologically distinct that it’s not especially surprising or informative to find that they differ. The question is: what do we learn beyond confirming the obvious?
As an ecologist, it is always fun to discuss how plants can adapt to living environments through evolution, especially for plants community geographically close but with contrasting environments. We are also more excited about finding something that we can clearly explain the driving factors, in this case, due to change in aridity. You’ve probably heard it be said “Look how different the vegetation is here, just an hour’s drive and everything has changed”. These kinds of natural transitions give us a unique opportunity to ask why and how plants differ.
Eco-Evolutionary Optimality theory (EEO), developed by LEMONTREE and many collaborators, considers the role of vapour pressure deficit (VPD) (a measurement of atmospheric dryness). Alongside temperature, VPD is one of the most critical variables in EEO. Afterall, we know that plants suffer from aridity and are suffocated from inundation. However, to date, we haven’t published a paper to systematically review and articulate how EEO expects each plant functional trait to vary from wet to dry places, holding other variables unchanged.
I am delighted to share that our newly published paper in Communications Biology addresses this gap. Rather than start with field data, we started with theoretical expectations from EEO. The introduction and method section of this study explained these theories in detail but to summarise:
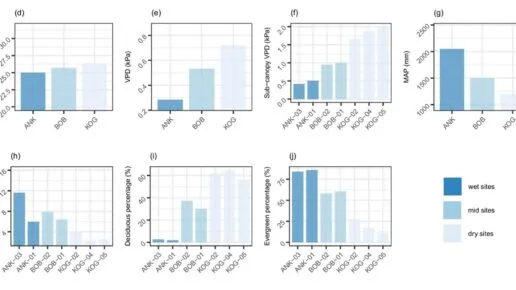
In tropical vegetation, plants in drier environments experience higher VPD, leading to less stomatal openness, thus lower leaf internal CO2 (ci/ca). Drier environments often mean less cloud and thus more sunlight (measured by PPFD), allowing plants to make greater use of available light. To utilize more energy during the growing season, plants require higher maximum rates of photosynthetic electron transport (Jmax) and electron transport-limited rate of CO2 assimilation (Aj). But since photosynthesis is co-limited by Aj and Rubisco-limited assimilation (Ac), plants must also increase Vcmax (the maximum rate of Rubisco carboxylation) so they don’t waste their high Aj potential. These changes collectively raise dark respiration and light-saturated assimilation rates (Asat400 and Asat2000).
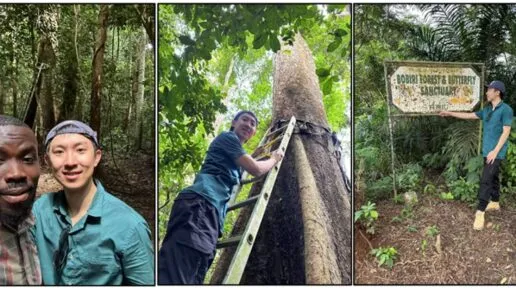
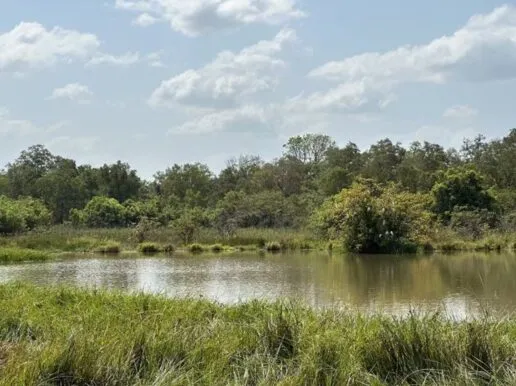
To test these predictions, we collected plant functional trait data along a 250km wet-to-dry gradient in Ghana, spanning three nature reserves. Whilst this isn’t a global meta-analysis, rather a focussed, regional study, nevertheless, we showed that field measurements do corroborate the above photosynthesis-related expectations.
.
One may expect that, along the wet-dry gradient, plant functional traits associated with water transportation would show remarkable pattern. However, it is not as clear as photosynthesis traits. Some hydraulic traits show some data-theory inconsistencies, especially those associated with xylem efficiency safety trade-off. We conducted a PCA combining photosynthetic and hydraulic traits, and found that deciduousness was a major factor structuring trait variation. Photosynthetic traits varied more clearly across the gradient than hydraulic traits.
Why might this be? We don’t fully know, but it is likely that the hydraulic traits here are stem and twigs traits, which are less sensitive to environments. Plants may have a range of options to connect leaves and root, which may experience less environmental variation than leaves and roots. Interestingly, We did find clear patterns in turgor loss point and Huber value (both linked to leaf hydraulics). We didn’t measure root traits, but we suspect these would show stronger responses to aridity and have earmarked this as an area for future research. Indeed, if you think about the water infrastructure in dry vs. wet regions, pipe size doesn’t necessarily change, so maybe the same applies to tree stems?
EEO theory is often applied in (or even proposed for) vegetation modelling. What would we suggest to modelers based on this study? It seems important and feasible to incorporate the dynamic variation in Vcmax, Jmax, and ci/ca in response to VPD. Huber value may also be incorporated with regards to carbon allocation. However, modelling hydraulic traits, at least in our study sites, appears to be mission impossible.